Plotting
This chapter of the Piccolo spectrometer documentation describes how to work with data recorded on the Piccolo. It explains how to go from the Pico files recorded by the instrument to a plot of the spectra. It also describes how to work with the metadata (also known as the headers) that are included in the data files.
Pico files
Overview
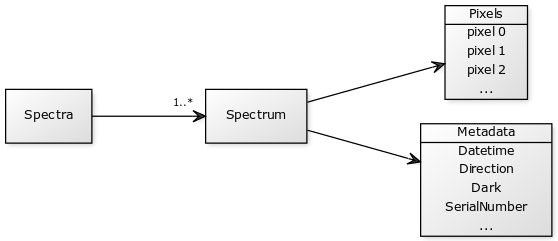
Every Pico file contains a Spectra object which is a list of spectra in the order that they were recorded.
Batches and sequences
The names of files saved in the data directory by Piccolo Server have the format:
title_batB_seqS_type.pico
where title is a description of the data, B is the batch number, S is the sequence number and type is the type of spectra in the file. pico is the file extension which identifies the file as a Pico file.
There are two spectrum types:
darkspectra are recorded with both shutters closedlightspectra are recorded with one shutter open and the other closed
The batch number (b) is zero padded to a width of six digits. Similarly, the set number (s) is padded to a width of six digits.
A batch of measurements consists of a number of sets. Each set contains of one upwelling spectrum for each spectrometer and one downwelling spectrum for each spectrometer. There are therefore four spectra in each set. Sets are numbered sequentially, starting from 1.
The first and last set in each batch will be dark. These sets are recorded with both shutters closed. These sets should be used to ensure that the dark current has not changed significantly during the recording of the batch (for example due to temperature changes). An additional check can be made by using optical black pixels.
The number of spectra in the batch will be the number of light sets requested plus the two dark sets.
For example, a the first batch in the data named plant with 100 sets will consist of 102 files with the names:
plant_000001_000001_dark.pico
plant_000001_000002_light.pico
plant_000001_000003_light.pico
...
plant_000001_000099_light.pico
plant_000001_000100_light.pico
plant_000001_000101_light.pico
plant_000001_000102_dark.pico
The next batch of 100 sets will have the names:
plant_000002_000001_dark.pico
plant_000002_000002_light.pico
plant_000002_000003_light.pico
...
plant_000002_000099_light.pico
plant_000002_000100_light.pico
plant_000002_000101_light.pico
plant_000002_000102_dark.pico
File structure
Each Pico file contains a single set of spectra within a batch. A set will usually consist of two spectra, one upwelling and one downwelling. If more than one spectrometer is connected, then the set contains upwelling and downwelling spectra recorded on each spectrometer.
File format
The format of the text within Pico files is JavaScript Object Notation (JSON).
Note
Despite its name, JavaScript Object Notation is not specific to the JavaScript programming language. It is actually a popular format for structured data which is supported by most programming languages, including Python.
The file contains an object called Spectra. This object contains an ordered list. Each specturm has both metadata and a list of pixel values.
The example below shows a Pico file containing a single spectrum. (The list of pixel values has been shortened.)
{
 "Spectra": [
  {
   "Metadata": {
    "Dark": true,
    "Datetime": "2015-08-16T17:58:53.048330Z",
    "Direction": "Upwelling",
    "FilterWavelength": "Missing metadata",
    "Grating": "Missing metadata",
    "IntegrationTime": 20.0,
    "IntegrationTimeUnits": "milliseconds",
    "NonlinearityCorrectionCoefficients": [
     0.849144,
     7.94044e-06,
     -7.61693e-11,
     -9.56982e-15,
     6.07747e-19,
     -1.68136e-23,
     2.2759e-28,
     -1.22882e-33
    ],
    "OpticalConfiguration": "B32 0",
    "PolynomialOrderOfNonlinearityCalibration": 7,
    "SaturationLevel": 29000,
    "SerialNumber": "USB2+H16355",
    "SlitSize": "Missing metadata",
    "SlitSizeUnits": "Missing metadata",
    "StrayLightConstant": 0.0,
    "WavelengthCalibrationCoefficients": [
     339.88843,
     0.37405726,
     -1.6419715e-05,
     -1.9436905e-09
    ]
   },
   "Pixels": [
    7,
    10408,
    339,
    302,
    440,
    440,
    440
   ]
  }
 ]
}
Metadata
Overview
The Metadata object is a (unordered) list of name/value pairs that describe the spectrum. The metadata fields are described in detail below. The fields which are included for each of the Ocean Optics’ series of spectrometers are shown in the table. In the table, the symbol ✓ means that this metadata field is available. A ✘ means that the spectrometer series or model does not provide this metadata field. Fields which are unavailable will have the value null in Pico files.
| Field | Flame | HR | Maya2000 Pro | NIRQuest | QEPro | USB |
|---|---|---|---|---|---|---|
| Batch | ✓ | ✓ | ✓ | ✓ | ✓ | ✓ |
| Datetime | ✓ | ✓ | ✓ | ✓ | ✓ | ✓ |
| Channel | ✓ | ✓ | ✓ | ✓ | ✓ | ✓ |
| FiberDiameter | ✓ | ✓ | ✓ | ✓ | ✓ | ✓ |
| FiberDiameterUnits | ✓ | ✓ | ✓ | ✓ | ✓ | ✓ |
| Filename | ✓ | ✓ | ✓ | ✓ | ✓ | ✓ |
| IntegrationTime | ✓ | ✓ | ✓ | ✓ | ✓ | ✓ |
| IntegrationTimeMaximum | ✓ | ✓ | ✓ | ✓ | ✓ | ✓ |
| IntegrationTimeMaximumUseful | ✓ | ✓ | ✓ | ✓ | ✓ | ✓ |
| IntegrationTimeMinimum | ✓ | ✓ | ✓ | ✓ | ✓ | ✓ |
| IntegrationTimeMinimumUseful | ✓ | ✓ | ✓ | ✓ | ✓ | ✓ |
| IntegrationTimeUnits | ✓ | ✓ | ✓ | ✓ | ✓ | ✓ |
| NonlinearityCorrectionCoefficients | ✓ | ✓ | ✓ | ✓ | ✓ | ✓ |
| PiccoloModel | ✓ | ✓ | ✓ | ✓ | ✓ | ✓ |
| PiccoloSerialNumber | ✓ | ✓ | ✓ | ✓ | ✓ | ✓ |
| PiccoloSoftwareVersion | ✓ | ✓ | ✓ | ✓ | ✓ | ✓ |
| OpticalPixelRange | ✓ | ✓ | ✓ | ✘ | ✓ | ✓ |
| Run | ✓ | ✓ | ✓ | ✓ | ✓ | ✓ |
| SaturationLevel | ✓ | ✓ | ✓ | ✓ | ✘ | ✓ |
| Sequence | ✓ | ✓ | ✓ | ✓ | ✓ | ✓ |
| SequenceType | ✓ | ✓ | ✓ | ✓ | ✓ | ✓ |
| SpectrometerManufacturer | ✓ | ✓ | ✓ | ✓ | ✓ | ✓ |
| SpectrometerModel | ✓ | ✓ | ✓ | ✓ | ✓ | ✓ |
| SpectrometerSerialNumber | ✓ | ✓ | ✓ | ✓ | ✓ | ✓ |
| TemperatureHeatsink | ✘ | ✘ | ✘ | ✓ | ✘ | ✘ |
| TemperaturePCB | ✓ | ✓ | ✘ | ✓ | ✘ | ✓ |
| TemperatureMicrocontroller | ✘ | ✘ | ✘ | ✘ | ✓ | ✘ |
| TemperatureDetectorActual | ✘ | ✘ | ✘ | ✓ | ✓ | ✘ |
| TemperatureDetectorSet | ✘ | ✘ | ✘ | ✓ | ✓ | ✘ |
| TemperatureUnits | ✓ | ✓ | ✘ | ✓ | ✓ | ✓ |
| ThermoelectricCoolerEnabled | ✘ | ✘ | ✘ | ✓ | ✓ | ✘ |
| ThermoelectricCoolerStable | ✘ | ✘ | ✘ | ✘ | ✓ | ✘ |
| WavelengthCalibrationCoefficientsPiccolo | ✓ | ✓ | ✓ | ✓ | ✓ | ✓ |
| WavelengthCalibrationCoefficientsSpectrometer | ✓ | ✓ | ✓ | ✓ | ✓ | ✓ |
| WavelengthUnits | ✓ | ✓ | ✓ | ✓ | ✓ | ✓ |
Fields
Batch
| Field | Data type | Example | Can be null? |
|---|---|---|---|
Batch |
number | 0 |
no |
The Batch metadata field gives the batch number that the spectrum was recorded in. A batch consists of multiple sequences (indicated by the Sequence metadata field) and a sequence consists of multiple spectra. The batch number is additionally indicated by the Filename metadata field and the filanem itself. It is an integer in the range 0 to 999999. Batches use Python numbering, so the first batch is batch 0.
..note:: When reading a Pico file into Python it is generally simpler to derive the batch number from the Batch metadata field and not the Filename.
Dates and times
| Field | Data type | Example | Can be null? |
|---|---|---|---|
Datetime |
string | 2015-08-16T17:58:53.048330Z |
no |
The Datetime metadata field gives the date and time at which the spectrum was recorded, according to the Raspberry Pi’s clock.
Note
The timezone for the combined date and time in the Datetime field is Coordinated Universal Time (UTC). UTC is also known as Zulu time and the letter Z is the UTC designator. It appears at the end of every combined date and time to indicate that the time zone is UTC.
Warning
The Raspberry Pi does not have a real-time clock, so it does not remember the date and time between interruptions of power. It is possible that the value in this field is incorrect if the clock has not been set.
Channel
| Field | Data type | Example | Can be null? |
|---|---|---|---|
Channel |
string | upwelling |
no |
Direction is one of the following:
upwellingdownwelling
Note
Upwelling means radiation travelling in an upward direction towards a downward-looking sensor. Downwelling means radiation travelling in an upward direction towards a downward-looking sensor. So the terms upwelling and downwelling refer to the direction the light radiation is travelling in, not the direction the sensors are looking in.
Fiber
| Field | Data type | Example | Can be null? |
|---|---|---|---|
FiberDiameter |
numeric | 400 |
yes |
FiberDiameterUnits |
string | micrometre |
no |
The optical inputs are connected to the Piccolo instrument by fiber optic cables. The FiberDiameter metadata field gives the size of the core of the optical fiber which was used in acquiring the spectrum. The units are micrometres (µm), as indicated by the FiberDiameterUnits metadata field.
The value of the fiber diameter for each channel (upwelling, downwelling) and each spectrometer is recorded in the instrument configuration file.
Note
The fiber diameter refers to the diameter of the core of the optical fiber and excludes the cladding and jacket.
Filename
| Field | Data type | Varies | Example | Can be null? |
|---|---|---|---|---|
Filename |
string | yes | s0003_b000032_dark.pico |
no |
The Filename metadata field contains the name of the file that the sequence was saved to. The filename has the format shown in the example in the table above. The sequence number is included in the filename, prefixed by the letter s. The batch number is prefixed by the letter b. This is follwed by a single word to indicate the spectrum type. The type can be light or dark.
Integration time
| Field | Data type | Example | Can be null? | Configurable? |
|---|---|---|---|---|
IntegrationTime |
number | 102.000 |
no | yes |
IntegrationTimeMaximum |
number | 3600000.000 |
no | no |
IntegrationTimeMaximumUseful |
number | 10000.000 |
no | yes |
IntegrationTimeMinimum |
number | 2.000 |
no | no |
IntegrationTimeUnits |
string | milliseconds |
no | no |
The integration time used for the measurement. The IntegrationTimeUnits field always has the value milliseconds.
The integration time is a number greater than zero. It is rounded to to a precision of 0.001 ms (1 µs). This is the supported spectrometers allow setting of the integration time to a precision of 0.01 ms or 0.001 ms.
Note
For most real measurement scenarios it is not necessary to set the integration time as precisely as microsecond-level.
Warning
The precision of the integration time depends on the spectrometer’s hardware, specifially the resolution of the integration time counter. Setting an integration time with microsecond does not imply that the actual integration time is so precise.
Nonlinearity correction
| Field | Data type | Example | Can be null? |
|---|---|---|---|
NonlinearityCorrectionCoefficients |
array | [0.993...] |
no |
This array of numbers contains a number of elements (typically eight) which allow application of a nonlinearity correction formula. They are read from the spectrometer’s memory when the spectrometer is initialized.
Optical pixel range
| Field | Data type | Example | Can be null? |
|---|---|---|---|
OpticalPixelRange |
array | [22, 3669] |
yes |
All spectrometers read a one-dimensional array of pixels from the detector. A subset of these pixels, the optical pixel range, contain spectral information. Other pixels are either unused or masked to use for electronic dark current correction.
Note
The Piccolo is equipped with shutters to measure dark currents and therefore does not use electronic dark current correction.
When plotting spectra, only pixels within the optical pixel range should be plotted.
The table below gives the optical pixel range for each spectrometer. Pixels are numbered such that the first pixel is pixel 0. The ranges specified (first and last) are inclusive.
| Spectrometer | All pixels | Optical pixels | |||||
|---|---|---|---|---|---|---|---|
| Manufacturer | Model | First | Last | Total | First | Last | Total |
| Ocean Optics | Flame-S | 0 | 2047 | 2048 | 20 | 2047 | 2028 |
| Ocean Optics | Flame-T | 0 | 3681 | 3682 | 22 | 3669 | 3648 |
| Ocean Optics | QE Pro | 0 | 1043 | 1044 | 10 | 1033 | 1024 |
Warning
The ranges given in the table above are inclusive. This convention differs from Python array slice notation.
Warning
The Ocean Optics NIRQuest spectrometer does not provide information about the optical pixel range. The OpticalPixelRange metadata field will therefore have the value null.
Piccolo
| Field | Data type | Example | Can be null? |
|---|---|---|---|
PiccoloModel |
string | Doppio |
yes |
PiccoloSerialNumber |
string | P2_0001 |
yes |
PiccoloSoftwareVersion |
string | 2.0.0 |
yes |
The three metadata fields listed in the table above describe the Piccolo, giving its model name, serial number and the version of the Piccolo software that is running on the instrument.
The model name and serial number of the Piccolo instrument which recorded the spectrum. These values are read from a memory chip on the Piccolo’s printed circuit board. Some older Piccolo instruments are not equipped with a memory chip, so these values may be null.
Warning
The software version indicated by this field is the version of the Piccolo firmware that is running on the Raspberry Pi. If the instrument is being controlled with Piccolo Player or Piccolo Client, the version numbers must all be identical.
Saturation
| Field | Data type | Varies | Example | Can be null? |
|---|---|---|---|---|
SaturationLevel |
number | no | 29000 |
no |
The saturation levels for the spectrometers are
| Model | Saturation | Read from spectrometer? |
|---|---|---|
| Flame-S | 28,000 | yes |
| USB2000+ | 29,000 | yes |
| Flame-T | 32,000 | yes |
| NIRQuest | 63,161 | yes |
| QEPro | 200,000 | no |
Ocean Optics spectrometers use a procedure called autonulling to scale pixel values.
Pixel values read from a spectrometer have a range between zero counts and the saturation level. The saturation level is different for each spectrometer model and cannot be inferred from the resolution of the analogue-to-digital converter.
Sequence
| Field | Data type | Example | Can be null? |
|---|---|---|---|
Sequence |
number | 5 |
no |
Gives the sequence number of the spectrum. Sequences are grouped into batches (Batch) and numbered sequentially, starting from zero. The sequence number is also given in the Filename metadata field, and the filename itself. In the filename it is prefixed with the letter s to distinguish it from the batch number. The sequence number is an integer in the range 0 to 9999.
Spectrometer
| Field | Data type | Example | Can be null? |
|---|---|---|---|
SpectrometerManufacturer |
string | Ocean Optics |
no |
SpectrometerModel |
string | USB2000+ |
no |
SpectrometerSerial |
string | USB2+H16355 |
no |
The spectrometer’s saturation level is the maximum pixel value that can occur in a spectrum. A value equal to the saturation level usually indicates that the integration time is set too high.
..note:: The saturation level is related to auto-nulling and pixel scaling.
Run
| Field | Data type | Example | Can be null? |
|---|---|---|---|
Run |
string | trees |
no |
Each group of batches is given a Run name. The files for each Run are stored in separate subdirectories of the Piccolo data directory. This is usually on a USB flash drive.
Temperatures
| Field | Data type | Example | Can be null? |
|---|---|---|---|
TemperatureHeatsink |
number | yes | |
TemperaturePCB |
number | 15.892791748046875 |
yes |
TemperatureDetectorActual |
number | -9.887267112731934 |
yes |
TemperatureDetectorSet |
number | -10.0 |
yes |
TemperatureMicrocontroller |
number | 34.384765625 |
yes |
TemepratureUnits |
string | degrees Celcius |
no |
Gives the temperatures of various components of the spectrometer. Different spectrometers have different temperature sensors, so values may be null.
Warning
The TemperatureDetectorSet value is read from the spectrometer, not from the Piccolo instrument configuration file. Changing the value in the instrument configuration file should change the value of the `TemperatureDetectorSet metadata field, though only if the serial number is specified correctly.
Note
The numerical values of the temperatures are not rounded by the Piccolo firmware, they are simply recorded exactly as read from the spectrometer. The number of decimal places does not imply that the temperature readings that precise.
Thermoelectric cooler
| Field | Data type | Example | Can be null? |
|---|---|---|---|
ThermoelectricCoolerEnabled |
boolean | false |
yes |
ThermoelectricCoolerStable |
boolean | true |
yes |
Information about the state of the thermoelectric cooler which controls the temperature of the spectrometer’s detector. For spectrometers without a thermoelectric cooler this field will have the value null.
SequenceType
| Field | Data type | Example | Can be null? |
|---|---|---|---|
SequenceType |
string | light |
no |
The sequence type can be light or dark.
Wavelength
| Field | Data type | Example | Can be null? | Configurable? |
|---|---|---|---|---|
WavelengthCalibrationCoefficientsPiccolo |
array | yes | yes | |
WavelengthCalibrationCoefficientsSpectrometer |
array | [ 344.99734, 0.218061, -6.331727e-06, -4.1425971e-10 ] |
no | no |
The wavelength calibration coefficients is a list (array) of four values which are used to calculate a the wavelength for every pixel on the spectrometer. These values are determined by calibration, often using a mercury lamp. All Ocean Optics spectrometers are programmed with a set of four wavlength coefficients at the factory. These values are read from the spectrometer by the Piccolo software and saved into data files in the SpectrometerWavelengthCalibrationCoefficients metadata field.
In addition to the calibration values programmed into the spectrometer, the Piccolo can be calibrated independently using a mercury lamp. The calibration corrects for any long-term drift in the spectrometers, and any difference between the upwelling and downwelling inputs.
Note
Pixels are numbered from zero, and include non-optical pixels. So a spectrometer with 2048 pixels will have pixels numbered from 0 to 2047 inclusive.
The calirbation equation.
The first element of the list is the zeroth coefficient (symbol I or C0). It is the wavelength of the first optically-active pixel (pixel 0). The first optically-active pixel can be determined using the information in the OpticalPixelRange field.
The second element of the list is the first coefficient (C1), the third element is the second coefficient (C2) and the fourth element is the third coefficient (C3).
The information in this field, together with OpticalPixelRange and NumberOfPixels can be used to calculate the wavelength of each optically-active pixel.
The units of the wavelength calibration coefficients are nanometres.
Pixels
Overview
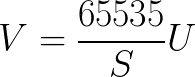
Method
The set of raw pixel values U read from the spectrometer can be converted to scaled pixel values V if the saturation level S is known:
Saturation equation.png
The range of scaled pixel values (V) is always from 0 counts to 65,535 counts.
Importing
Pico files can readily be imported into Python, MATLAB or other software.
MATLAB
Using importpico
The MATLAB function importpico can read Pico files recorded on the Piccolo into MATLAB. It can read a single file, or multiple files, into a MATLAB structure (struct).
Installing importpico
The function is in a MATLAB m file called importpico.m. It can be downloaded from the MATLAB function in the Source tab on Bitbucket. (The Source tab is on the left-hand side of the Bitbucket web page. It looks like a document icon.)
The file importpico.m must be saved to a directory which is in the MATLAB search path.
To find out which directories are in the MATLAB (“user”) search path type:
userpath
in MATLAB. Save importpico.m to this directory.
To check that MATLAB can find the file type:
help importpico
If MATLAB can find importpico.m this will show a summary of how to use it.
Using importpico
To import a single Pico file type:
P = importpico('00001.xml')
This will import the file 00001.xml into a structure called P in the MATLAB workspace. The output will be:
Importing 00001.xml...

P =

1x4 struct array with fields:

    direction
    dark
    spectrometer
    header
    data
    wavelength
In this case P is a 1x4 struct, i.e. it contains 4 spectra. The spectra are saved in the file in the order they are
recorded. This is (commit e2d5a12):
- Upwelling dark
- Upwelling
- Downwelling dark
- Downwelling
For example the second element of P should be the upwelling spectrum. Typing P(2) gives:
ans =

     direction: 'upwelling'
          dark: 'no'
  spectrometer: 'USB2000+'
        header: [1x1 struct]
          data: [2048x1 double]
    wavelength: [2048x1 double]
To plot all four spectra in P type:
plot([P.wavelength], [P.data])
Tip
The syntax [P.data] is useful for combining multiple vectors into a single matrix. The equivalent in Python is a list comprehension.
To import multiple files use wildcards (e.g. *) in the filename. For example, typing:
Q = importpico('*.xml')
will import all XML (now JSON) files in the current working folder into a struct called Q.
Since each file contains 4 spectra (upwelling dark, upwelling, …), if n files are imported Q will be a nx4 structure.
For example, if 11 files are imported MATLAB outputs:
Q =

11x4 struct array with fields:

  direction
  dark
  spectrometer
  header
  data
  wavelength
To plot the first spectrum of the fifth file type:
plot( Q(5,1).wavelength, Q(5,1).data )
Python
Pico files use a file format based on Javascript Object Notation (see File format). can be imported into Python using the json modules.
See Issue 56.